Reports 2007-2008Space Debris ProyectINTRODUCTION:This document briefly describes how the Geostationary and Transfer Orbits Object Survey has been carried out during the period of time that ranges from August 2003 to December 2006, at the Optical Ground Station (OGS), under subcontracts: 1) Subcontract E/17825-01 of contract 17825/03/D/HK ESOC-ESA “Space Debris Optical Observations and Analysis with ESA 1M Telescope”. 2) Subcontract E/15836-01 of contract 15836/01/DK/HK ESOC-ESA “Extension of Optical Observations Capability for the Zeiss 1M Telescope”, Phase 1 and 2. We present some statistics about the site atmospheric conditions (seeing), the distribution of the observation nights and the different technical problems found during the achievement of the observational campaigns of 2003, 2004, 2005 and 2006.
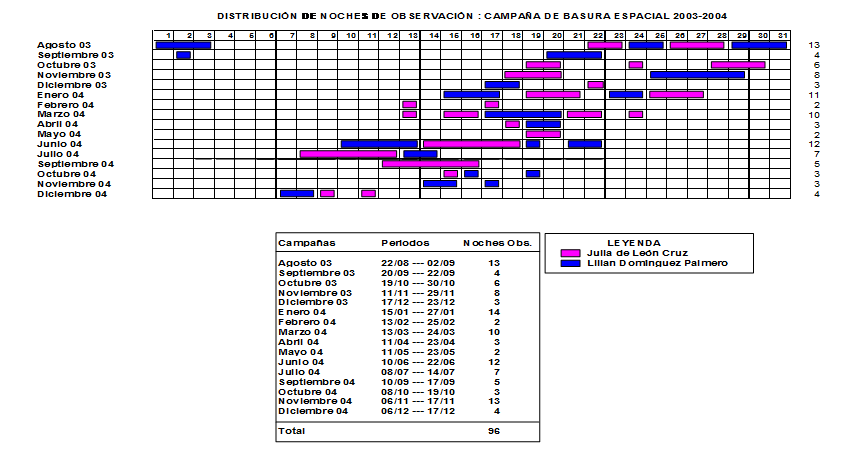
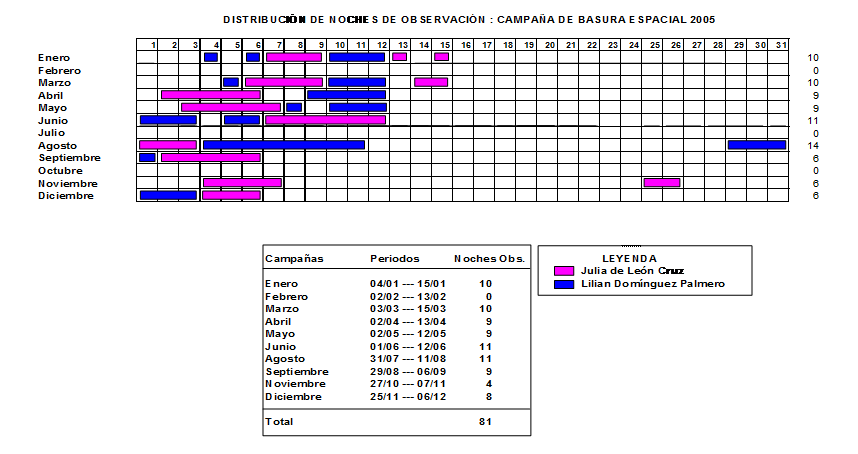
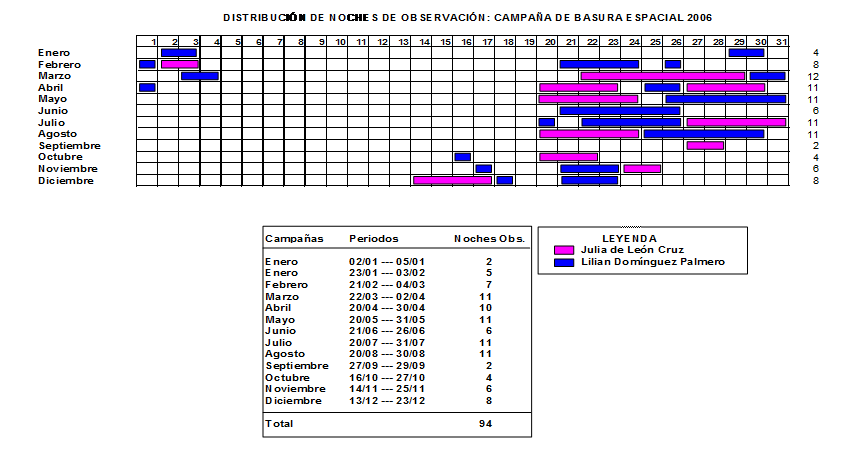
THE CAMPAIGNSThe Geostationary and Transfer Orbits Object Survey has been distributed over monthly campaigns, selected, among other criteria, to coincide with as much dark nights as possible around the New Moon, to avoid scattered light. Figures 1, 2 and 3 show a diagram of the distribution of the observation nights during the different campaigns. The number that appears at the end of each row of the diagram indicates the number of observation nights each month (these will be considered as “good nights”, according to the criteria defined in the contracts). Those nights were the astronomer was not at the observatory (due to a prolonged bad weather situation or persistent technical problems) have not been taken into account.
Figure 1. Distribution of the observation nights (“good nights” according to the contract definition) of the 2003-2004 campaign of the Geostationary and Transfer Orbits Object Survey.
Figure 2. Distribution of the observation nights (“good nights” according to the contract definition) of the 2005 campaign of the Geostationary and Transfer Orbits Object Survey.
Figure 3 . Distribution of the observation nights (“good nights” according to the contract definition) of the 2006 campaign of the Geostationary and Transfer Orbits Survey.
DISTRIBUTION OF THE OBSERVATION TIME:
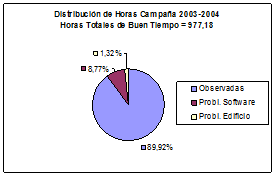
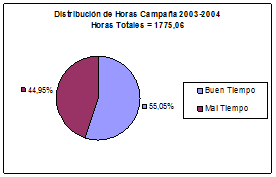
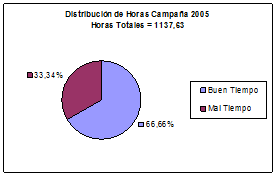
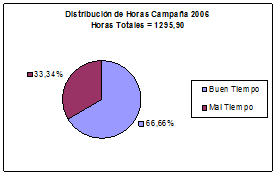
We have planned a total of 1775,06 hours in the 2003-2004 Space Debris Campaign (starting in August 2003), spread over 96 effective observation nights (“good nights” according to the contract definition). For 2005 Space Debris Campaign, the number of hours is 1137,63, with 81 effective observation nights. In the 2006 Space Debris Campaign, we did observations during 94 effective nights, over a total of 1295,90 planned hours at the beginning of the year.
Figure 4. Distribution of the observing time during the whole period of the 2003-2004 Space Debris Campaign (starting in August 2003).
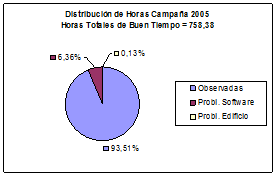
Figure 5. Distribution of the observing time during the whole period of the 2005 Space Debris Campaign.
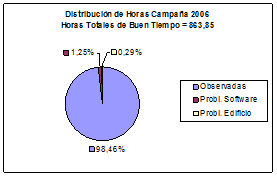
Figure 6. Distribution of the observing time during the whole period of the 2006 Space Debris Campaign.
As Figures 4, 5 and 6 show, more than a 55% of the observing time in all the campaigns, was dedicated to do observations, which is a clear indication of the good weather conditions prevailing over the years. This percentage is even higher for 2005 and 2006 campaigns. The other two aspects that caused lost time were software problems (mainly at the Level-1 Control System), and problems related to the building itself (dome control and general power down), but always in a percentage less than 10%. All in all, we did not lose too much observational time due to these problems, which gives an idea of the efficiency of the overall system.
SEEING CONDITIONS:We have measured seeing values during the observational period of the Geostationary and Transfer Orbits Object Survey. These measurements include atmospheric seeing and perturbations introduced by dome-telescope system. The technique used to obtain these values is the following. In order to focus the telescope at the beginning of a typical observation night we normally take an unbinned image of 10 secs. Using the IRAF imexam task, we observe radial profiles and note down values of the FWHM of different stars in the field of view. Once we find the appropriate value of the focus, we take the maximum and the minimum FWHM and get the average value. Finally we multiply this value with the CCD resolution : 0,62 arcsec / pixel.
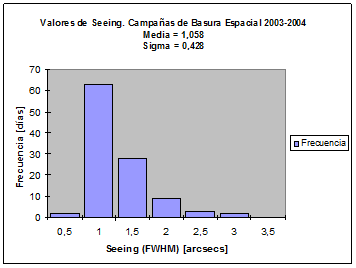
Figure 7. Histogram of seeing values for 2003-2004 Space Debris Campaign (starting August 2003).
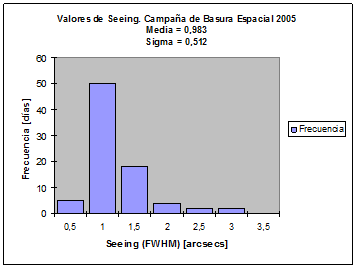
Figure 8. Histogram of seeing values for 2005 Space Debris Campaign.
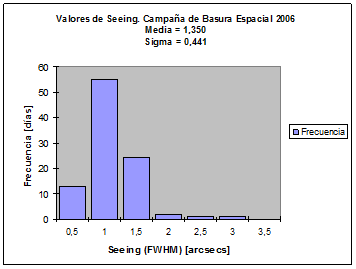
Figure 9. Histogram of seeing values for 2006 Space Debris Campaign.
The great sky quality of the Observatorio del Teide can be seen at Figures 6, 8 and 9. They show the distribution of seeing values during all the effective nights over the Space Debris campaigns of the last years. The three histograms present their maxima near 1,0 arcsec. This is comparable to the values registered at the IAC 80 telescope from 1/Oct/98 to 9/May/99 (see http://www.iac.es/telescopes/ten.html and click on IAC80 and seeing for further information ). The dome of the Optical Ground Station is quite big and its contribution to the perturbations of the overall system is not negligible. Some simulations and the experience gained in other telescopes led to a typical value of 0,5 arcsec, which has been conveniently subtracted in order to do the histogram.
CONCLUSIONS:The main conclusions that can be derived from this report are: • No significant problems appeared during the execution of the Level-1 Telescope Control System or the On-line Data Processing System, and the ones that appeared were easily solved, as can be seen in Figures 4, 5, and 6. We are currently working in a new control system for the space debris wide field camera and telescope. • Control systems related to the dome and the building had also an excellent behaviour. • Excellent weather conditions contributed to a great extent to increase the number of “operational” observing nights, and the great sky quality of the Observatorio del Teide has been also decisive for the achievement of the whole project. • After having seen the results of the Space Debris campaigns of 2003, 2004, 2005 and 2006, we can conclude that they have undoubtedly been good campaigns, regarding the distribution of the observing time and seeing conditions.
|
|---|
